

TL;DR:
Management Reports Every Distributor Needs From TallyPrime. TallyPrime’s built-in Dashboard and Cost Centres offer distributors an instant, bird’s-eye view of sales, stock health, and individual salesperson performance without requiring complex IT skills. These native tools pull data from over 350 reports into a single screen, allowing you to monitor real-time business health and profit per customer immediately. By using these features, you can turn daily data entry into powerful management insights without investing in expensive external software.
Introduction: How to Get Management Reports Every Distributor Needs From TallyPrime
In my 20 years of experience in fields of industrial distributors and auditing dealerships, the most common frustration I hear is: “I have all this data in Tally, but I still feel like I don’t know the real-time health of my business.” Many owners I work with feel buried under stacks of paper or tangled Excel sheets just to answer a simple question like, “Are we actually making money today?”
I’m here to tell you that you don’t need to be a data scientist to get these answers. TallyPrime has evolved; it now features sophisticated dashboards and specialized registers that track stock levels, and profit-per-party automatically. You already have the power at your fingertips, you just need to know which buttons to press.
Can I See My Whole Business on One Screen?
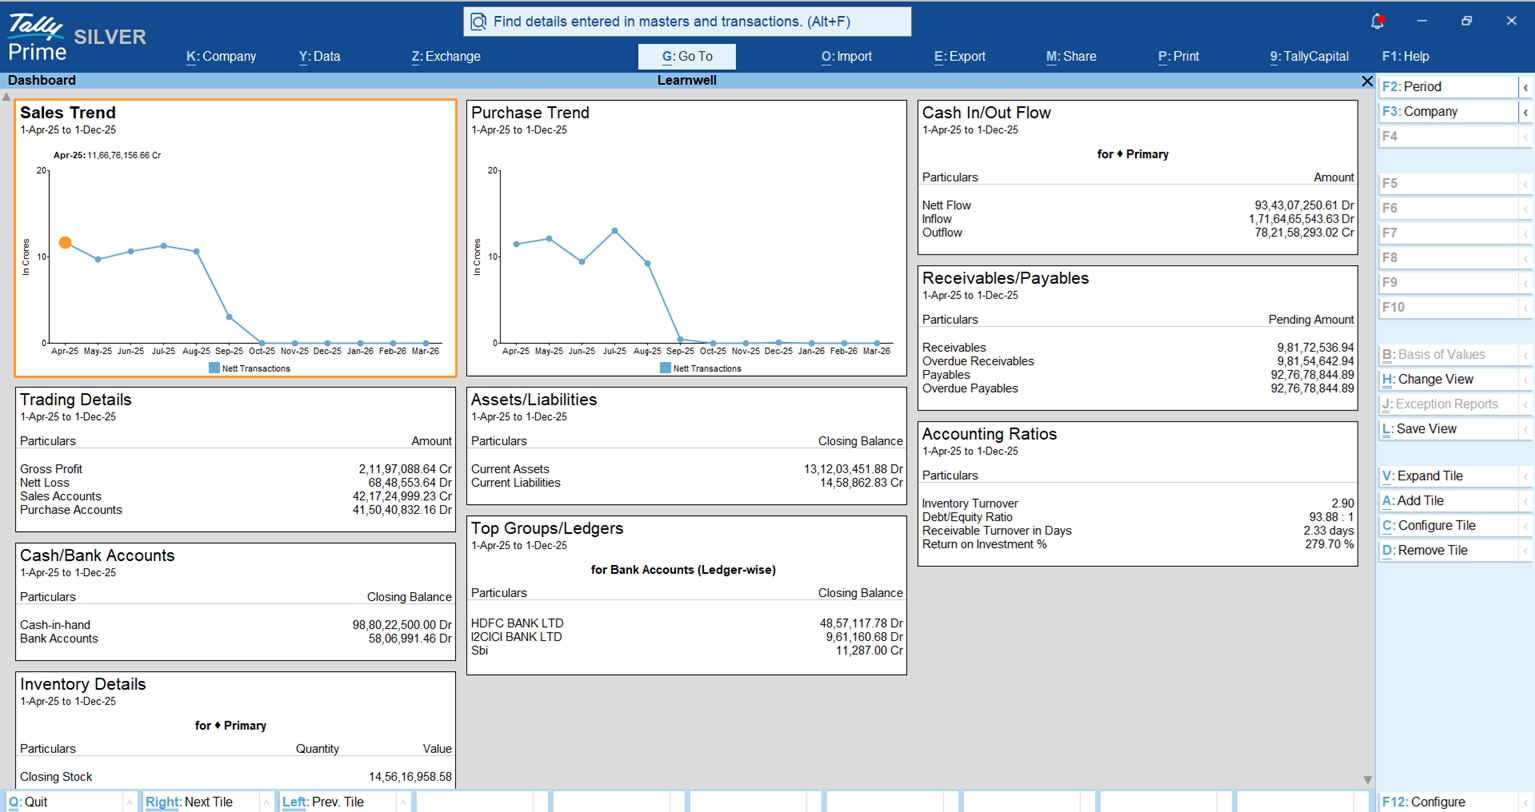
Think of the TallyPrime Dashboard as your mission control. It gathers data from over 350 different reports to give you a consolidated view of your company’s financial vitals.
The default Dashboard includes these critical tiles:
- Sales & Purchase Trends: Visual line or bar graphs showing performance over time.
- Trading Details: A quick snapshot of your gross margins and nett profit.
- Receivables/Payables: Know exactly who owes you and whom you owe.
- Cash/Bank Accounts: Monitor your liquidity to avoid cash-flow crunches.
- Top Groups/Ledgers: See which accounts are driving your business.
- Accounting Ratios: High-level metrics like Current Ratio or Net Profit Ratio.
How-To Get There: Simply press Alt+G (Go To) > type Dashboard and press Enter. Also can open from Gateway of Tally Screen Dashboard.
Advisor Tip: Don’t wait until the end of the day to check this. You can set the Dashboard as your startup screen so it’s the first thing you see when you load your company. Go to F1 (Help) > Settings > Startup and set “Open Dashboard on loading a Company” to Yes.
Who Are My Best Salespeople and Are They Collecting Cash?
In my experience, every dealership has a “Raja” a salesperson who is fantastic at closing deals but terrible at chasing the money. If you only look at your sales numbers, Rohit looks like a star, while your cash flow is actually dying.
By using Cost Centres, you can track both Sales and Collections to see the full picture.
Simple 3-Step Setup:
- Enable: Go to F11 (Features) and set “Enable Cost Centres” to Yes.
- Create: Go to Create > Cost Centre and enter the Salesperson’s name.
- Tag: When entering a Sales Invoice or a Receipt, tag the salesperson’s name in the Cost Centre field.
To see the reports:
- For Sales:
Gateway of Tally > Display More Reports > Statement of Accounts > Cost Centres > Ledger Breakup > select Sales account. - For Collections:
Gateway of Tally > Display More Reports > Statement of Accounts > Cost Centres > Group Breakup > Sundry Debtors.
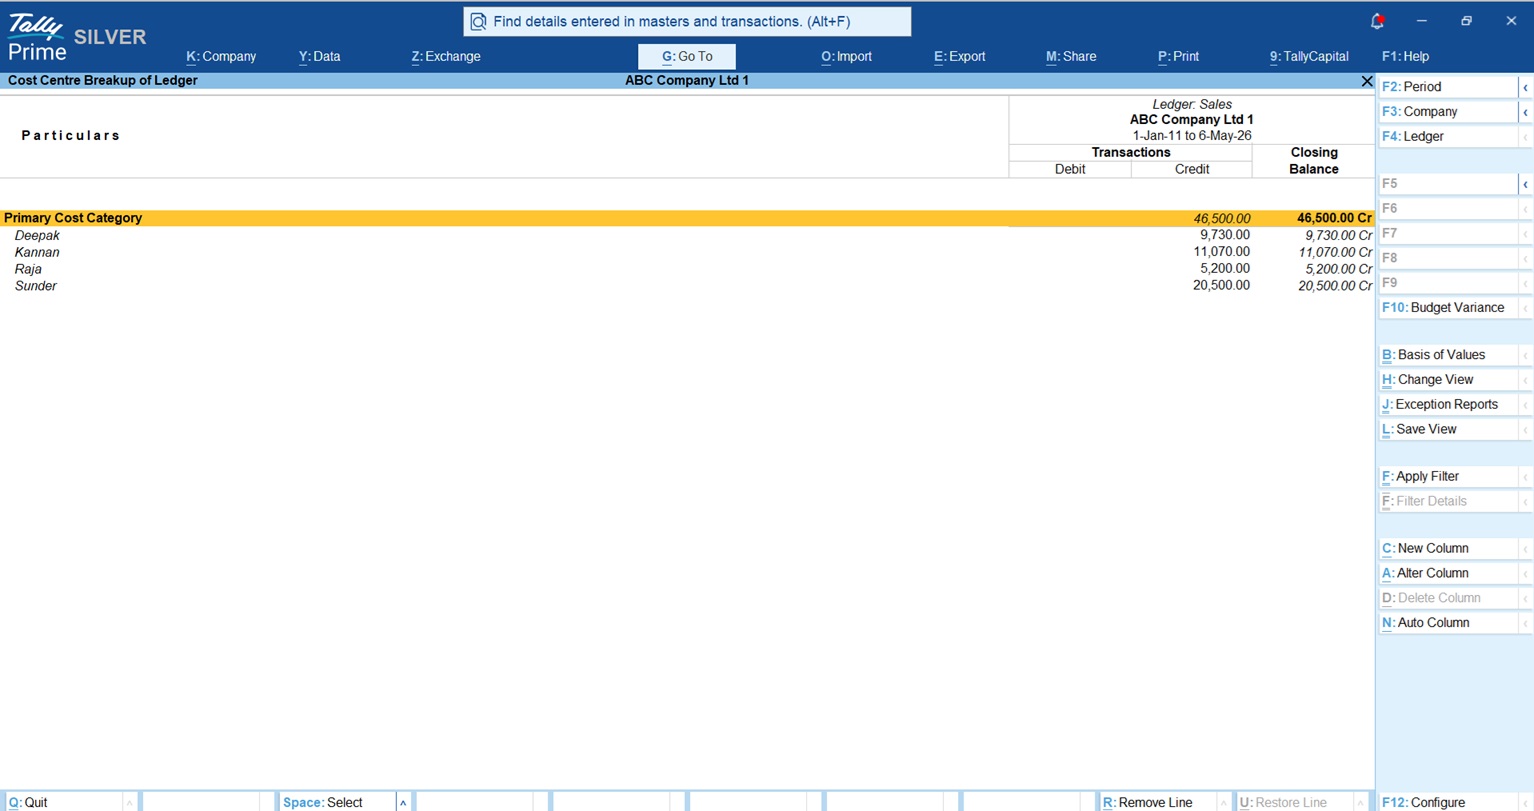
This second path is the “truth teller”, it shows you exactly how much each person has collected against the credit they’ve given out.
Read more about Cost Centre – Types, Purpose & Examples
Will I Run Out of My Best-Selling Items?
In the industrial world, running out of a high-demand item like “Grade-8 Bolts” can halt a customer’s entire production line. TallyPrime’s Reorder Level feature ensures you never have to say “out of stock.”
- Simple Reorder: This is like a “low fuel” light. You set a fixed quantity (e.g., “Always keep 500 bolts in stock”).
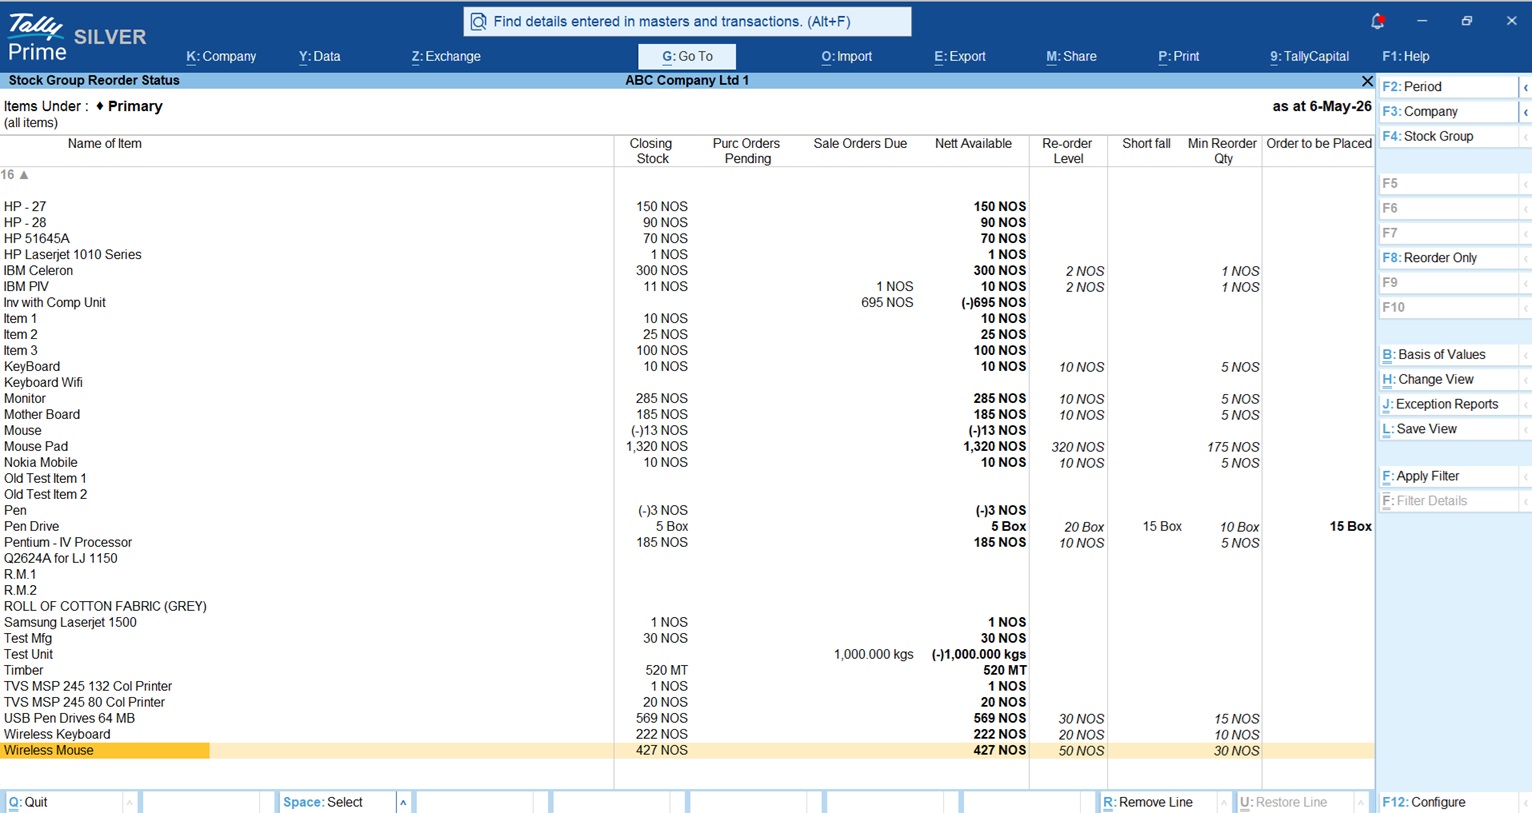
The Reorder Status Report This is your warning system. Pay close attention to the Nett Available column:
| Column | The “Golden Formula” | What it Means |
| Purc Orders Pending | — | Goods you’ve ordered but haven’t received yet. |
| Sales Orders Due | — | Goods promised to customers but not yet shipped. |
| Nett Available | Closing Stock + Pending Purchases – Sales Due | The actual stock you can rely on. |
| Shortfall | — | The gap between your Reorder Level and Nett Available. |
Navigation Path: Press Alt+G > type Reorder Status.
Know more about Re-order Level in TallyPrime
Am I Actually Making a Profit on Every Party?
Being “busy” is not the same as being “profitable.” You might be moving massive volume for a specific customer (Party), but after discounts and costs, you might be barely breaking even.
Inside the Sales Register (Gateway of Tally > Display More Reports > Account Books > Sales Register), press F7 (Show Profit). This adds a “Gross Profit” column to every invoice.
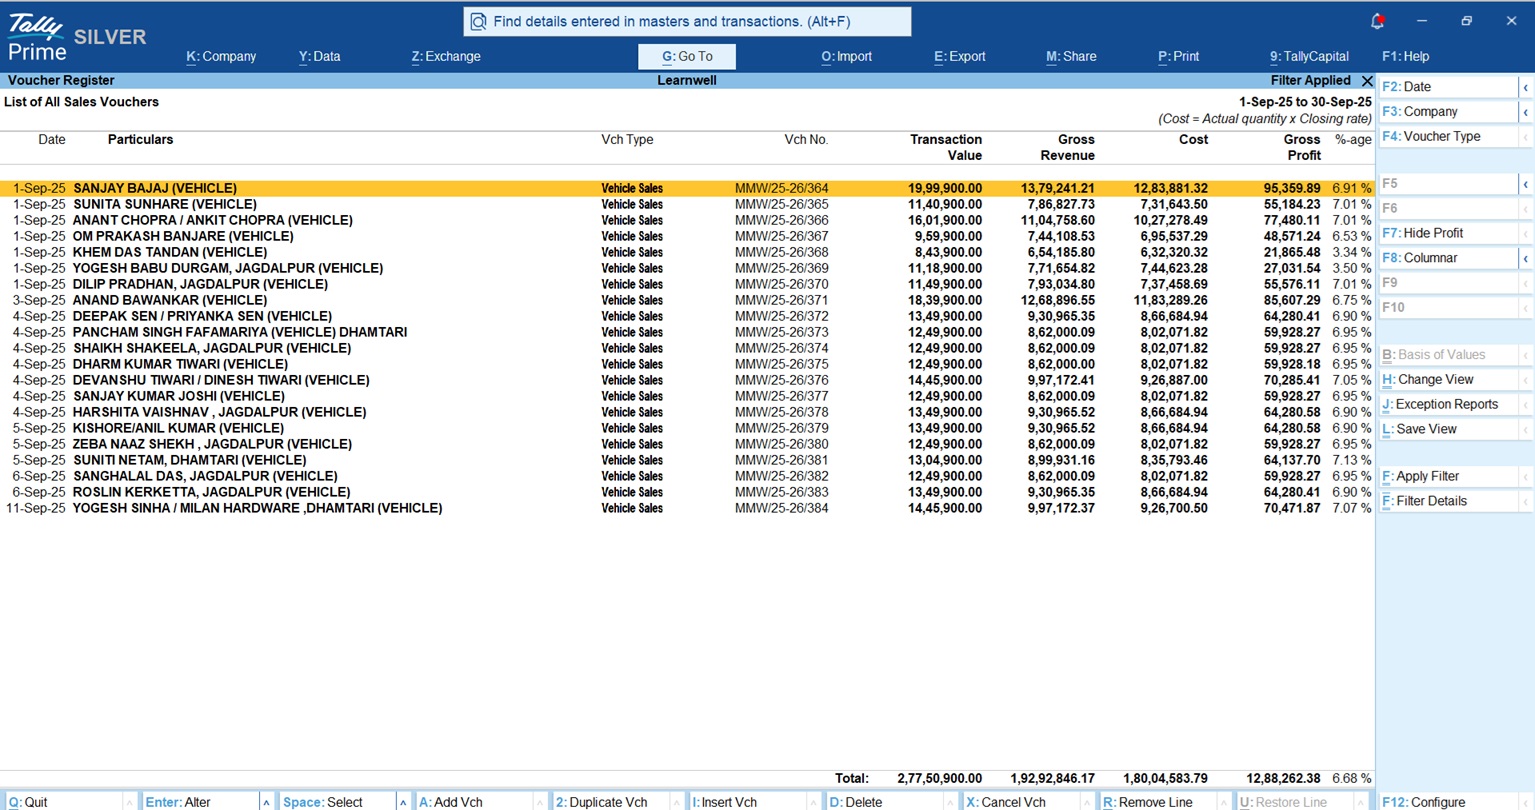
Advisor Note: The profit shown here is an estimate based on your Stock Valuation Method (like FIFO or Avg Cost). Ensure your Item Master is correctly configured, or these numbers won’t reflect your true margins.
“Knowing your Gross Profit on every single bill is the difference between growing a business and just staying busy.”
You can create your invoice wise profit button with this method
Is My GST Data Ready for Filing?
Tax compliance shouldn’t be a month end panic. You can add Statutory Tiles to your Dashboard to monitor your GSTR-2A/2B reconciliation in real-time. This helps you catch mismatches with suppliers early, ensuring you don’t lose out on Input Tax Credit (ITC).
To add these:
- In the Dashboard, press Alt+A (Add Tile).
- Select Statutory from the categories.
- Choose the relevant GST tile.
Conclusion: Your 3-Step Action Plan
You don’t need to be a Tally expert to lead with data. I recommend my clients start with these three steps:
- Step 1: Set the Dashboard as your startup screen to keep your KPIs front and center every morning.
- Step 2: Start tagging every invoice to a Cost Centre today so you can evaluate your team fairly.
- Step 3: Use the Save View (Ctrl+L) feature. Once you configure a report exactly how you like it, save it so you never have to redo the settings.
FAQs: Quick Answers for Busy Owners
Can I see graphs in the Dashboard?
Yes. While on a tile, press Alt+C (Configure Tile) and set the Display Type to “Graph Only” or “Data & Graph.” You can even choose between bar and line graphs.
Can I see reports for two companies at once?
Yes. TallyPrime includes a “Company-wise comparison” tile. It is inactive by default, but you can add it by pressing Alt+A while both companies are loaded.
Will I lose a tile if I remove it?
No. Pressing Alt+D only hides the tile from your current view. It is not deleted from the database and can be added back via Alt+A anytime.
Do I need a browser to see this?
No. Unlike some other reports, the Dashboard is a TallyPrime-only feature. Because it requires complex drill-downs and configurations that aren’t yet supported on web interfaces, it works exclusively within the software for maximum speed and security.
Can my data entry operator see my profits?
Only if you let them. Go to Alt+K (Company) > User Roles. You can allow an operator to use the Dashboard but specifically “Disallow” them from sensitive tiles like “Accounting Ratios” or “Assets/Liabilities.”